DataGotham 2013 Talk, or Japanese vs Russian reviews
/I gave a talk recently at DataGotham (http://www.youtube.com/watch?v=1KfK0zOSo5U), and I’ve gotten a lot of questions about one particular/tr stat that I gave in that talk. If you write a tip in Russian, then you’re 3 times as likely to hate the place than if you write it in Japanese. Where does that come from?
Well, I don’t mean that the same person is going necessarily going to come to the same conclusion just by switching language - although that would be a neat experiment to run. What we did was first categorize our Foursquare tips by language, and for each tip we looked at people who liked and disliked the venue. This wasn’t done by language and not country, because for sentiment analysis we build a different model for each language (a negative english tip is a negative english tip anywhere).
It should also be pointed out that we’ve ignored tips that are written without an explicit review (even though we still do sentiment analysis on those). This ratio is simply negatives / (negatives + positives).
So it turns out that there’s a correlation between language and the type of review received by the venue. The reason for this is purely speculative, but some have suggested cultural differences. I’m open to hearing other hypotheses.
A few things to note: the data is overwhelmingly positive. Even Russian speakers are over 90% positive. Japanese and Russian are the two outliers among the languages we considered that really stuck out. The rest of the languages kind of bunched up in the middle.
Here’s a graph with all the languages I considered (some data had to be cut down for the data gotham slide). The 2-letter languages codes are from
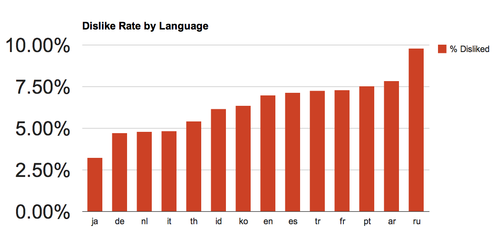
Here are the actual percentages:
japanese 3.25%
german 4.72%
dutch 4.79%
italian 4.84%
thai 5.44%
indonesian 6.16%
korean 6.37%
english 6.98%
spanish 7.14%
turkish 7.27%
french 7.31%
portuguese 7.55%
arabic 7.84%
russian 9.81%
Foursquare’s recent Tumblr post on the issue